I’ll preface this by saying that this will not be the most complex baseball analysis you’ve ever read. I understand that to make this worth anything, I’d need to factor in stadium anomalies, opposing pitcher records and fielding statistics. If you want an exotic smorgasboard of premium baseball analysis, I suggest heading over to the U.S.S. Mariner.com. Consider my contribution here the baseball equivalent of a food truck.
But this week I wondered aloud, what would it take for the Mariners to be the best hitting team in baseball? Are we one player away or nine? I really didn’t know so I dusted off my excel spreadsheet for this totally unscientific report.
The test is simple. If we replaced the lowest performing Mariners starter with the best hitter in baseball, how would team stats change? Then, how many times do we have to do that to be among the top?
Step 1: Where are we today?
Let’s take a look at the MLB Team Batting Averages, ranked 1-30. (Yes, I know Batting Average is an antiquated way to calculate offensive performance. Remember, I’m only working with a food truck kitchen.)

Step 2: What do our individual stats look like?
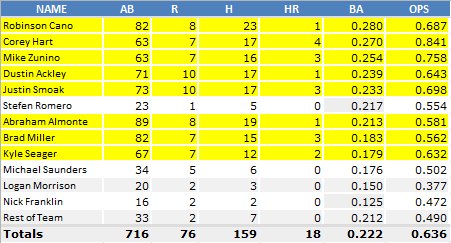
So here’s a quick look at the Mariners batting stats. I highlighted the starters, because that’s really the analysis we need to do. There are 8 clear starters, and 4 players who seem to regularly rotate around as that 9th player in the lineup, and a few guys with a couple of at bats each. So for the purpose of this discussion, which is trading one starter for another, we’ll only work with the 8 regulars.
Step 3: What happens when we trade our lowest performing starter for the leading hitter in baseball?
Again, we’re ranking the best hitter by average, not WAR, OPS or anything complex. Right now, that guy is Charlie Blackmon of the Colorado Rockies, who is off to a blistering .410 start. So here’s our new roster, subbing Blackmon for our lowest average starter, Kyle Seager.
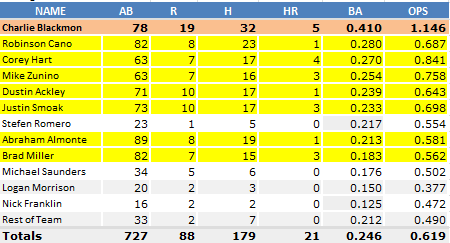
Our average jumped 24 points to .246. So by replacing our worst hitter with MLB’s best, we’ve only made it to 18th on the list.
Step 4: What happens when we trade our two lowest performing starters for the two leading hitters in baseball?
Once again we head to Colorado, where we are kidnapping Troy Tulowitski and putting him on a cargo plane north. This time it’s Brad Miller who is getting our ax.
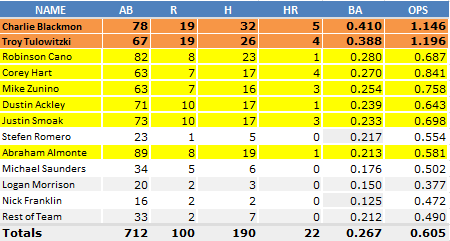
We’ve now jumped to .267 which puts us a very respectable 7th in the league. So what does it take to get to the top?
Step 5: What happens when we trade our THREE lowest performing starters for the THREE leading hitters in baseball?
Say good-bye to Abraham Almonte and please welcome Dayan Viciedo and his .377 average to the Pacific Northwest.
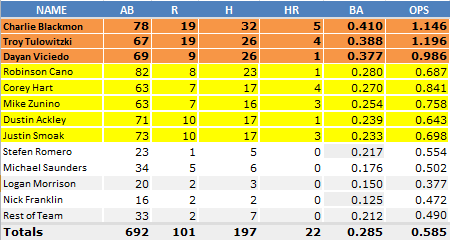
We’ve now swapped out 33.3% of our starting lineup, and raised our batting average 63 points. And yet, that still keeps us behind the League Leading Colorado Rockies. (And yes, I know that if we took two guys off their roster they wouldn’t be at .301 anymore. Just go with it.)
Bonus Section:
I have the spreadsheet built, so let’s do one more just for fun. Suppose we didn’t attain the three top hitters in baseball in what surely would be the savviest three-way trade in the history of baseball. Suppose we just ended up with three hitters who were at the MLB average replacing our lowest three.
Now, this is a little wonky, because I took the MLB averages for all the teams combined, and then divided those by 9. The reasoning is that each team has 9 spots in the batting order, so it’s a fair approximation of what the average player on the average team would do if he played in every game.
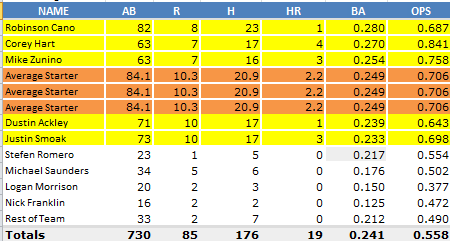
You see we jump up to .241, which only gets us in a tie for 22nd with Arizona.
Conclusion:
So how far are the Mariners away from having an offense that strikes fear into opposing pitcher rather than just striking out? Well, we are clearly more than 3 average hitters away. And it’s unlikely we’ll get the three top hitters. So we need at least three well above average hitters to dent the top 10.
If you have a Dropbox account, you can download the spreadsheet here. I don’t know why the numbers look weird in View mode.